Skills: Calculating population density using maps of a large city
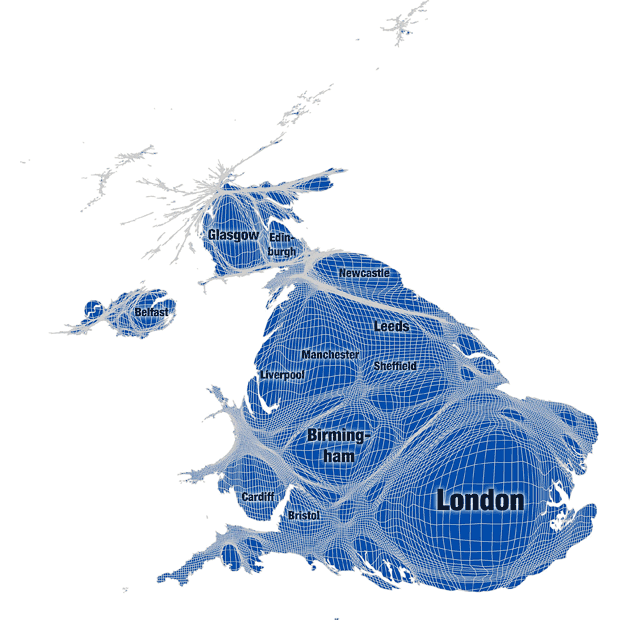
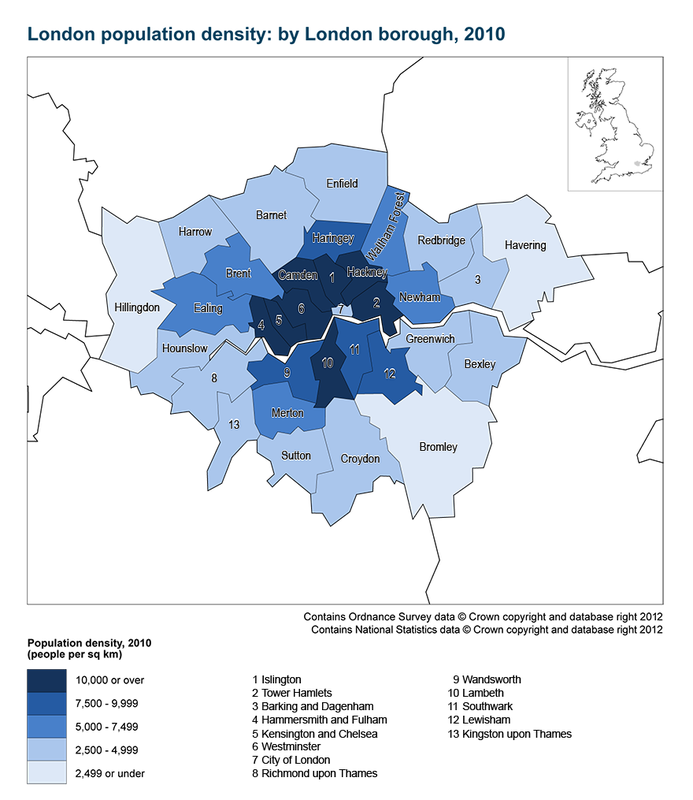
With reference to the maps below, write a description outlining the concentration of the population of UK in London, as well as a description of population density in greater London. Be sure to use the names of second tier cities (smaller cities), and boroughs (these are like suburbs).
http://www.telegraph.co.uk/education/educationpicturegalleries/6254582/Population-atlas-map-of-the-world-showing-population-density-in-each-country.html?image=1
http://www.ons.gov.uk/ons/publications/view-larger.html?edition=tcm%3A77-247453&chart=tcm%3A77-276322&contentid=tcm%3A77-275206
The Mapping London site has a wide variety of visualisations about the city of London. Some of these are visualisations are factual and geographic, while others are artistic. Examine the range of visualisations available on the page. Choose 3 that are suitably geographic and write a paragraph about each one explaining what it tells you about the city of London.
Mapping London


